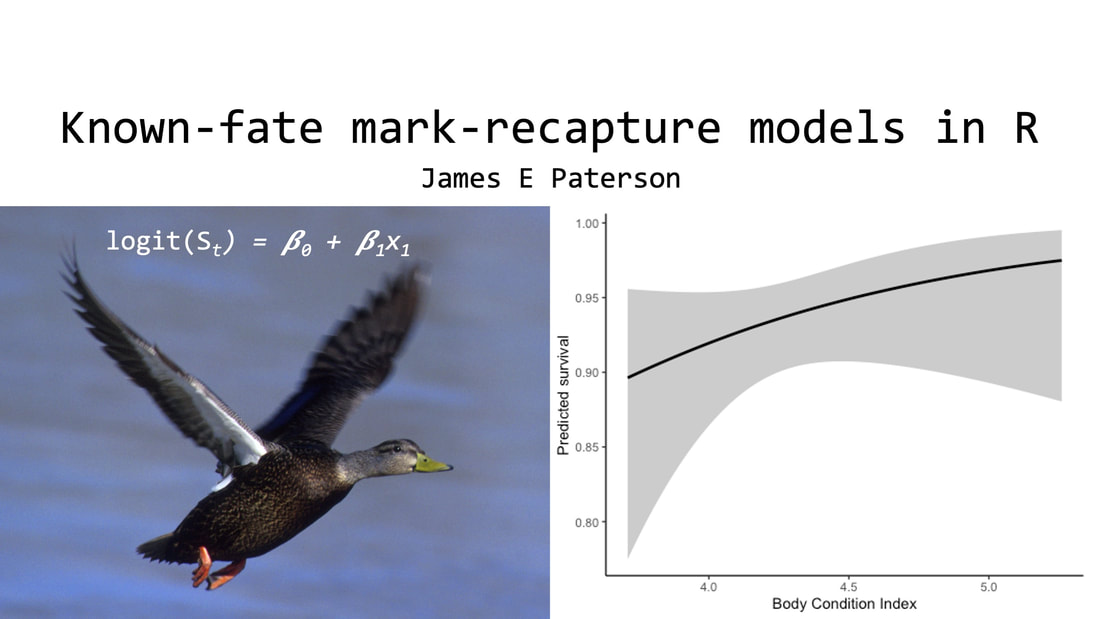
 In this tutorial, I cover:
1. How known-fate mark-recapture models work 2. Fitting basic known-fate mark-recapture models with the 'RMark' Package in R. The code from this tutorial is available on my mark-recapture workshop GitHub repo. Note: my other mark-recapture tutorials use the 'marked' package, but that package does not fit known-fate survival models. Using RMark requires you to have MARK installed and accessible. See: http://www.phidot.org/software/mark/rmark/
I'm back! After more than two years, I've decided to continue posting new tutorials.
In this tutorial, I cover:
The code and sample data from this tutorial are available on my tracking workshop GitHub.
In this tutorial, I cover:
1. The difference between single season (static) and multi-season (dynamic) occupancy models, 2. Fitting dynamic occupancy models with the R package `unmarked`, and 3. Making inferences, predictions, and plotting results from dynamic occupancy models. The code and sample data from this tutorial are available on GitHub. 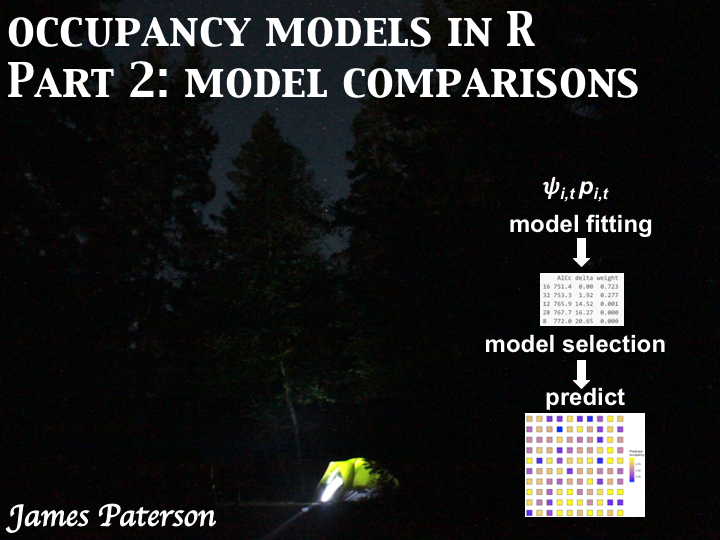 In this tutorial, I cover:
The code (and sample data) from this tutorial are available on GitHub. Let's get started!  In this tutorial, I cover:
1. What occupancy models are useful for 2. Fitting single-season occupancy models with the R package `unmarked` 3. Testing goodness-of-fit for single-season occupancy models The code (and sample data) from this tutorial are available on GitHub. Let's get started! 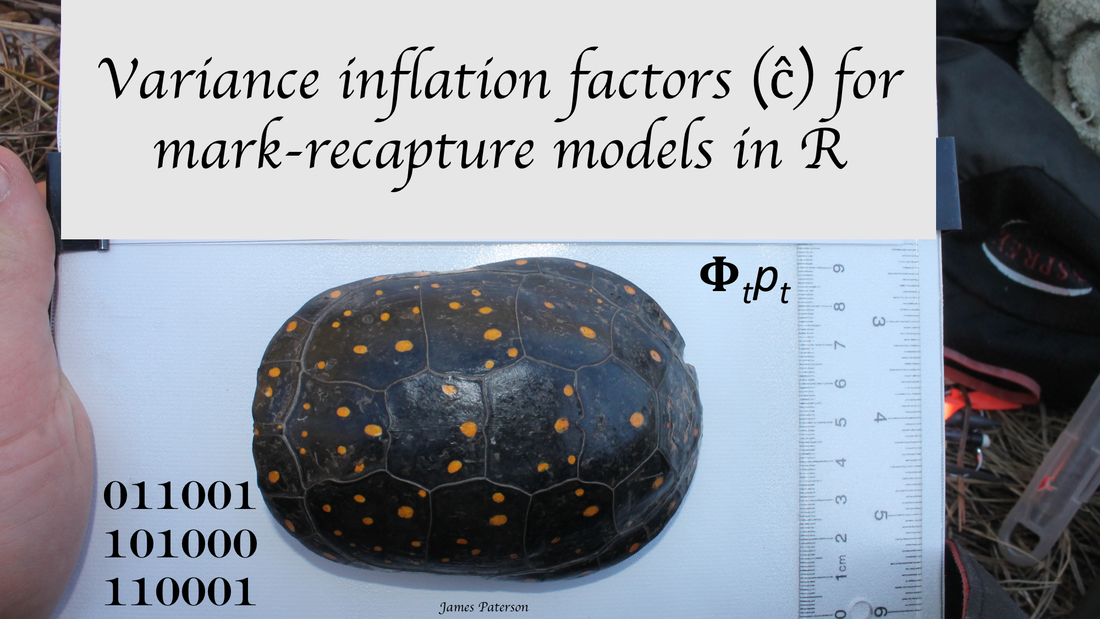 Mark-recapture models are a useful framework to test hypotheses about what drives differences in wildlife survival and detection probability. However, it is important to assess the goodness-of-fit (GOF) for these models before we make inferences.
What causes lack of fit?
In this tutorial, I deal with overdispersion by: 1. Calculating the variance inflation factor ("c-hat"). 2. Adjusting model selection when there is evidence of overdispersion. The code from this tutorial is available on my GitHub page for mark-recapture workshops. Let's get started! 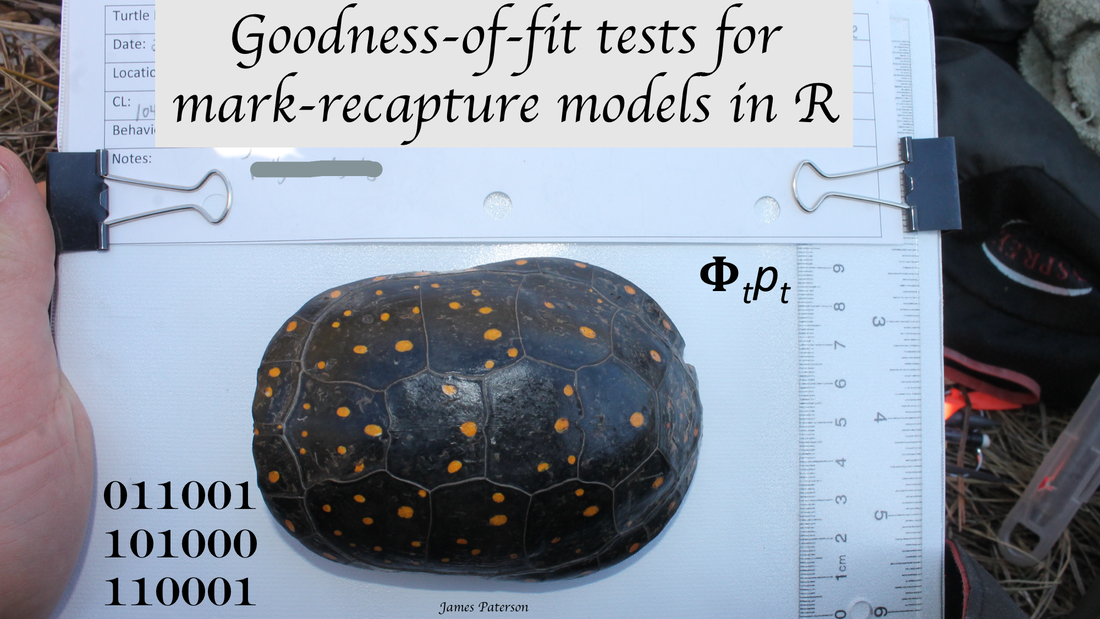 Mark-recapture models are a useful framework to test hypotheses about what drives differences in wildlife survival and detection probability. However, it is important to assess the goodness-of-fit (GOF) for these models before we make inferences.
What causes lack of fit?
In this tutorial, I cover testing assumptions of the Cormack-Jolly-Seber model using `R2ucare`.  Photograph of White-throated Dipper by Mark Medcalf (licensed under CC BY 2.0) Mark-recapture studies are useful for estimating population size and survival in wildlife populations, but can be overwhelming because of the massive amount of literature on their development and application.
Let’s dip our toes into some capture-recapture models using the famous `dipper` data set and the marked package in R. The syntax (and approach) is almost identical using RMark to access the widely used MARK program. The code from this tutorial is available on my GitHub page for mark-recapture workshops. Let’s get started! I've updated two posts to deal with changes to the Google Maps API, which makes downloading Google Maps tiles more challenging.
In brief, you need to register for a key, enter a credit card number and register the key within R to download Google map tiles as of mid 2018. There is a large amount of tiles that can be downloaded for free (as of this writing), but I have changed my tutorials to use Stamen map tiles, and included code on how to register for a key and use the Google tiles (if you still wish to). The posts that I updated (that used ggmap):
|
AuthorJames Paterson Archives
September 2023
Categories
All
|
 RSS Feed
